Lyra: Photo-Voltaic Systems Design Tool
We were approached with one of the most challenging and exciting projects I've been lucky to put my hands on: re-designging a browser-based photo-voltaic systems design tool. It became one of the most exciting, demanding and rewarding projects, from research to ideation, wireframing, and prototyping while also giving me the opportunity for learning about a new industry and acquiring new skills as well as a whole new perspective.
1. Learning
Before starting the research and design processes, the team had to focus -during the first two weeks of the project- on gaining proficiency in the state of the solar energy industry, the field's jargon, and a lot of thecnical matters related to photovoltaiv systems and electricity in general.
2. Exploration
After learning about the solar-energy industry we focused on understanding the current stage and offer of the product.
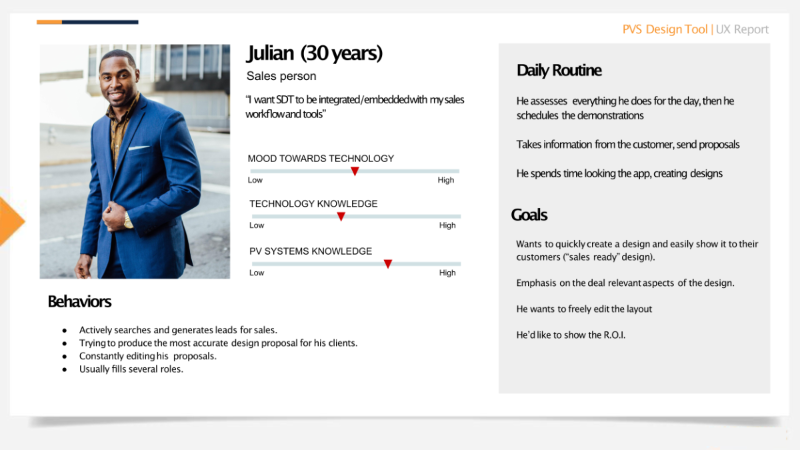
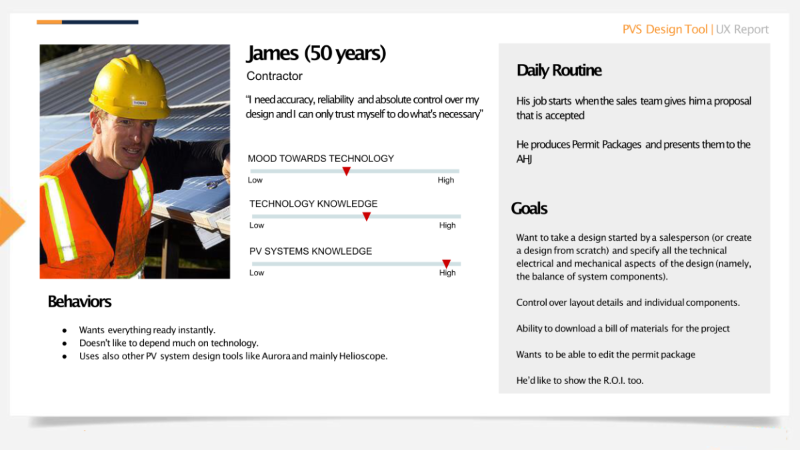
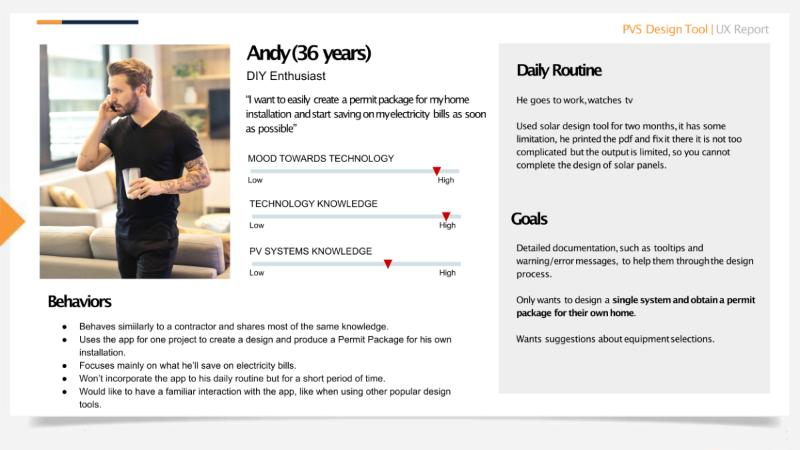
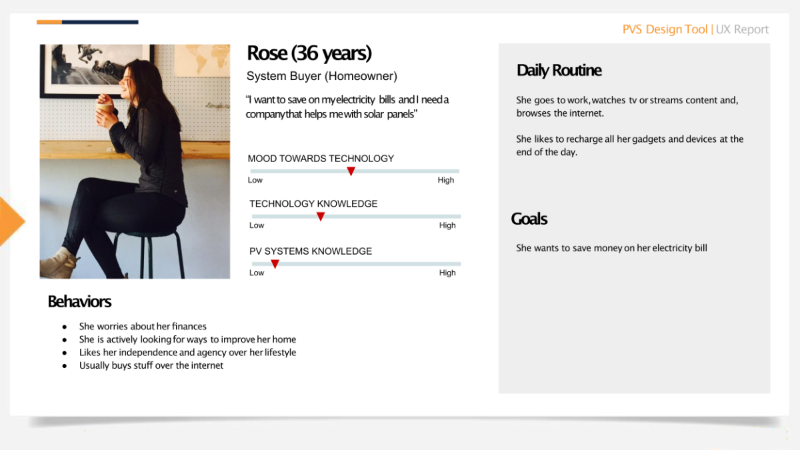
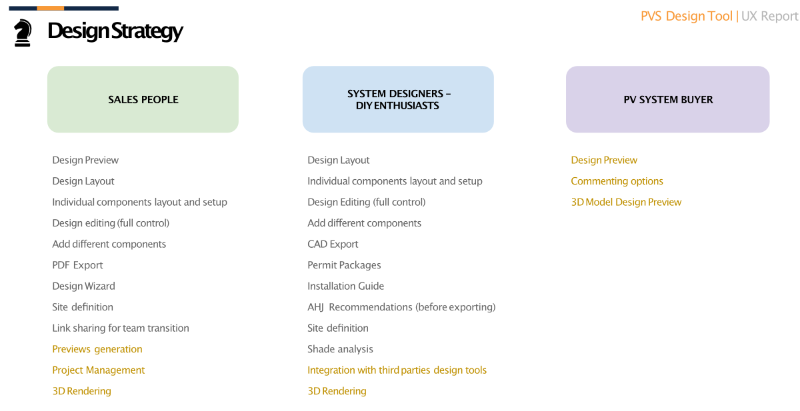
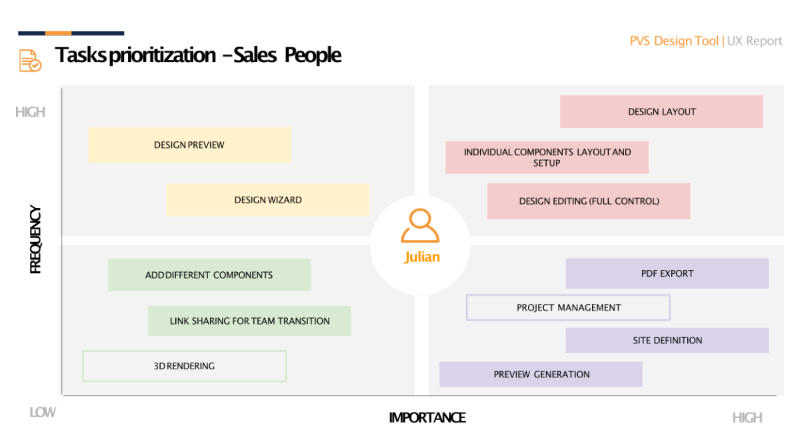
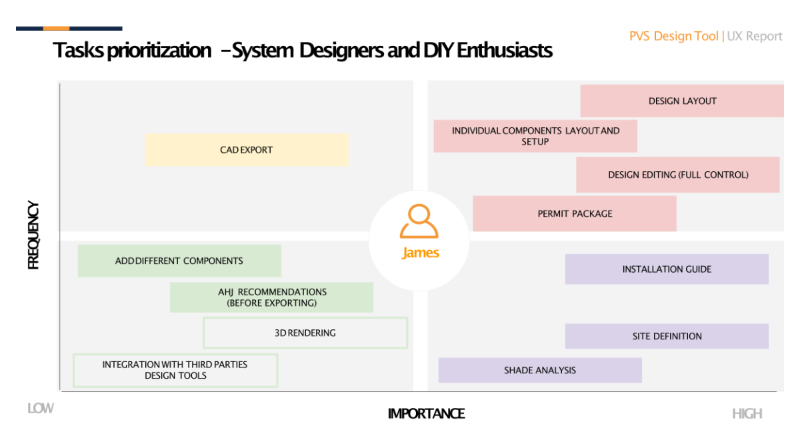
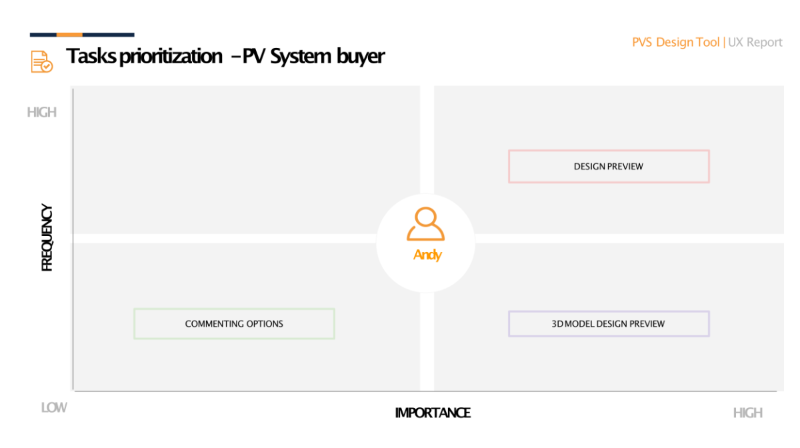
3. The users
By interviweing users of the platform and business stakeholders we were able to inform the creation of User Personas.
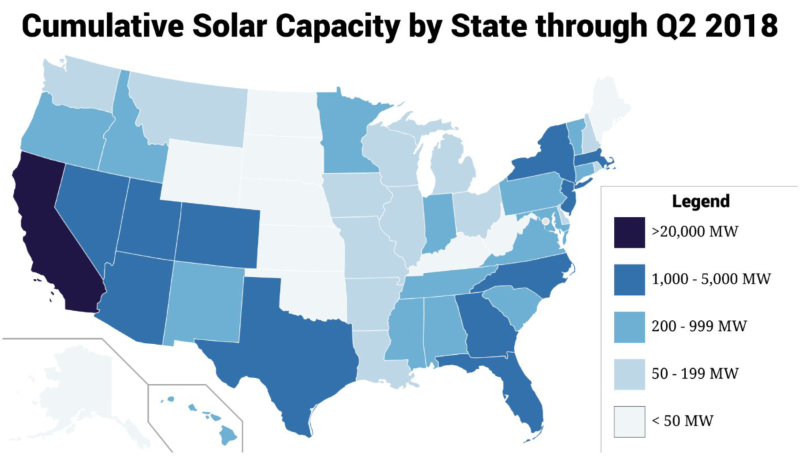
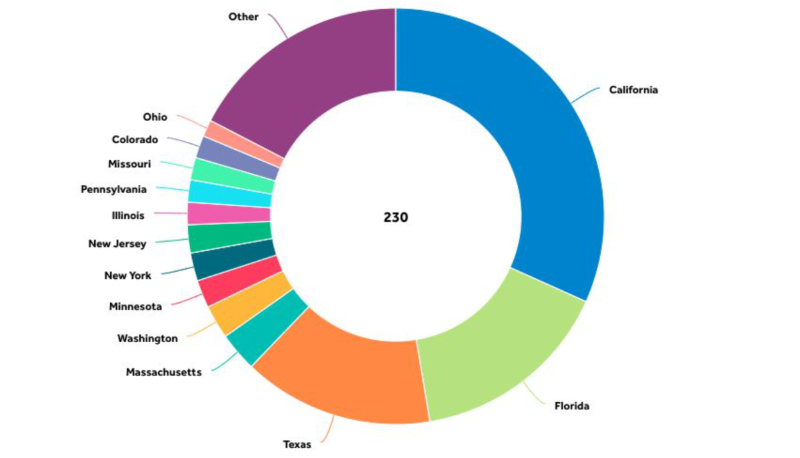
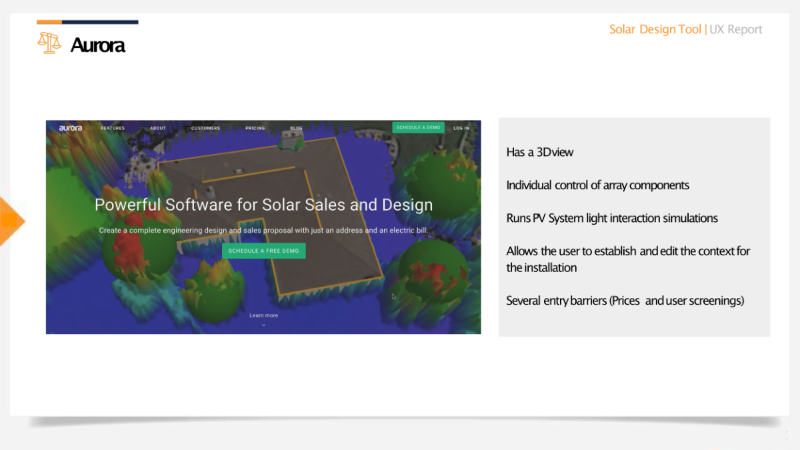
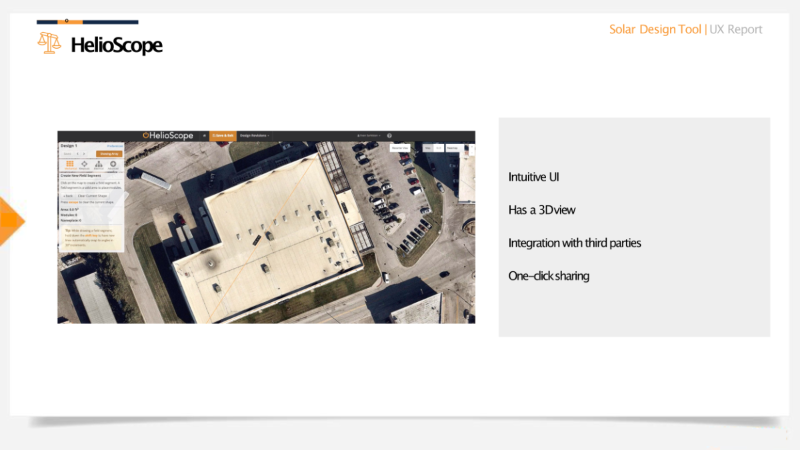
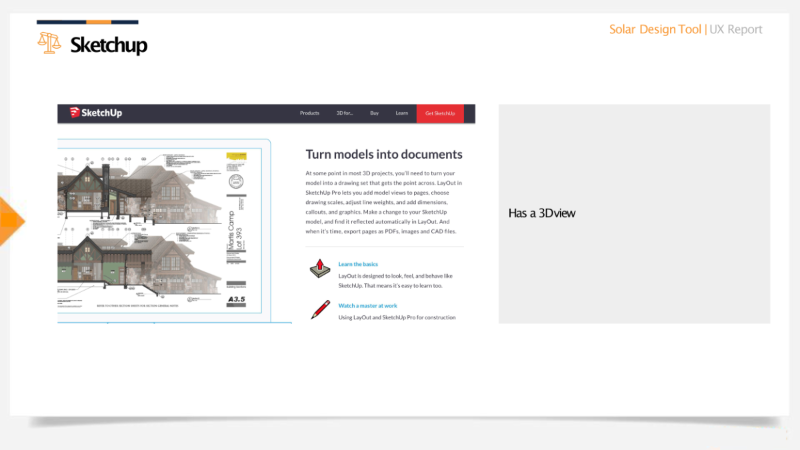
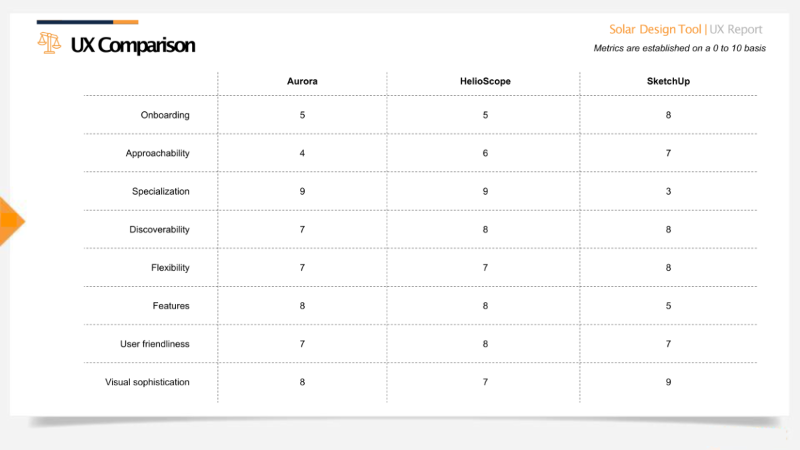
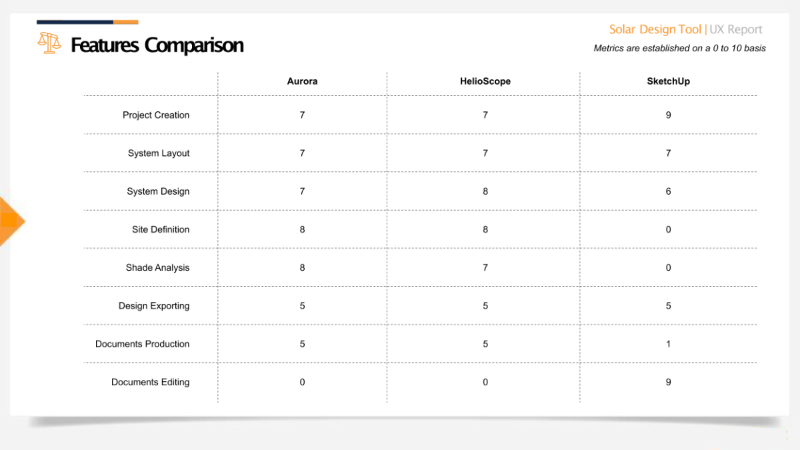
4. The state of the art
Of course, nothing appears in a vacum, so we benchmarked the competition and market at high level to have a good grasp on what the industry needs.
5. Planing
With enough inormation gathered we started the creation process, naturally by planing.
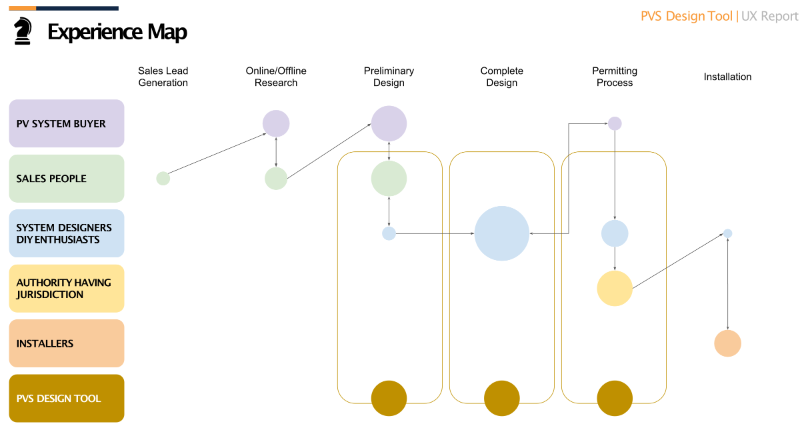
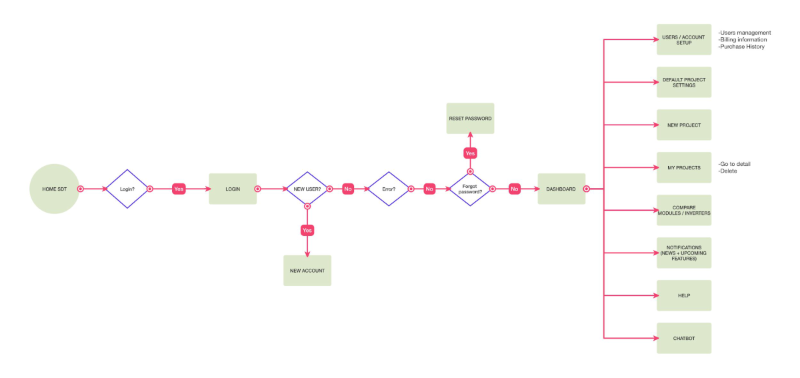
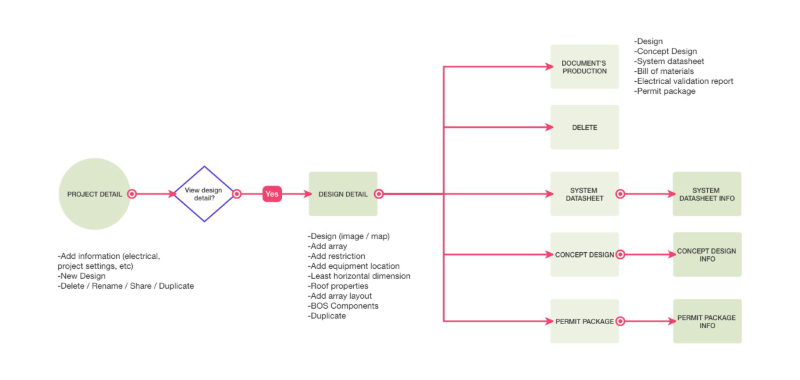
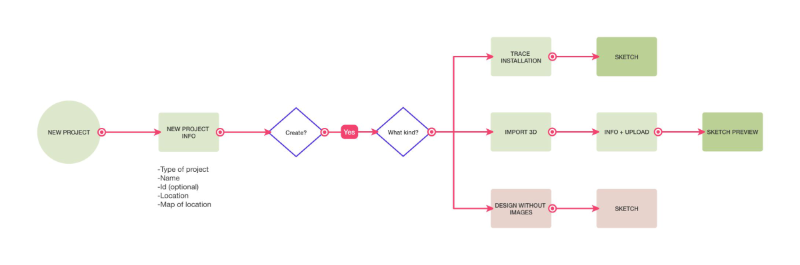
6. Designing
We started creating flowcharts and information architecture for the platform's re-deisgn.
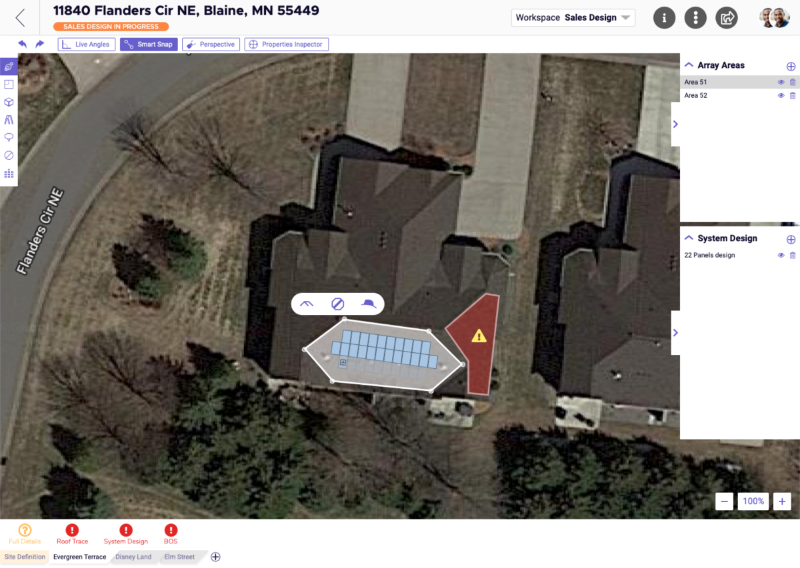
7. Interaction
We redifined the interaction and designed a new interface and a flexible design and business process for the final users.
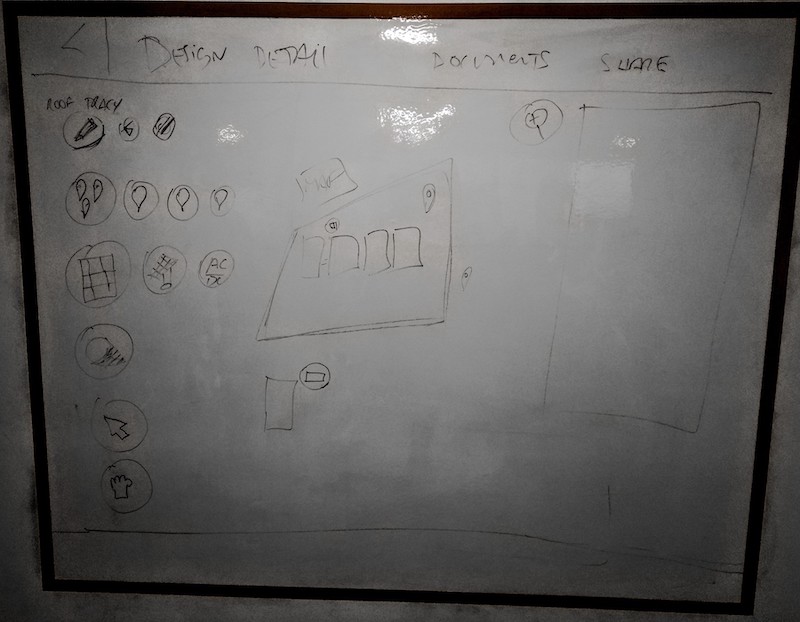
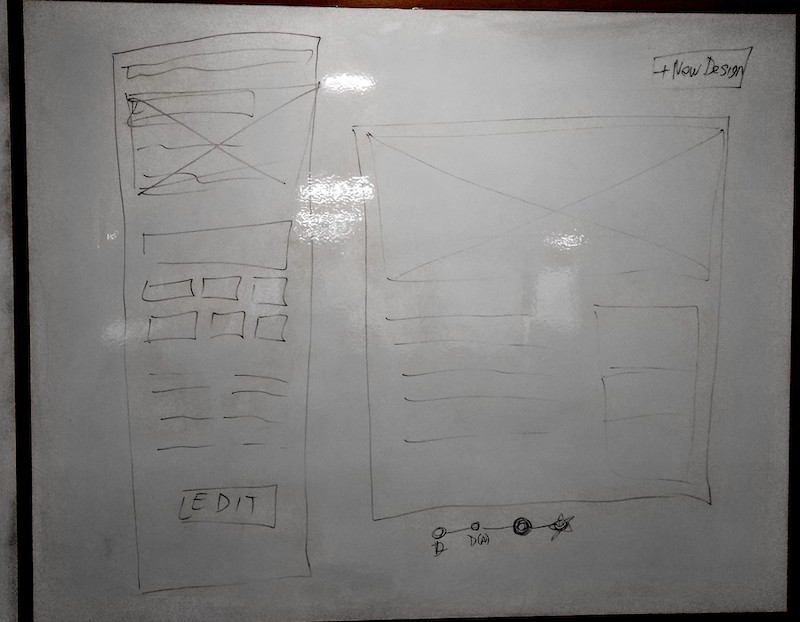
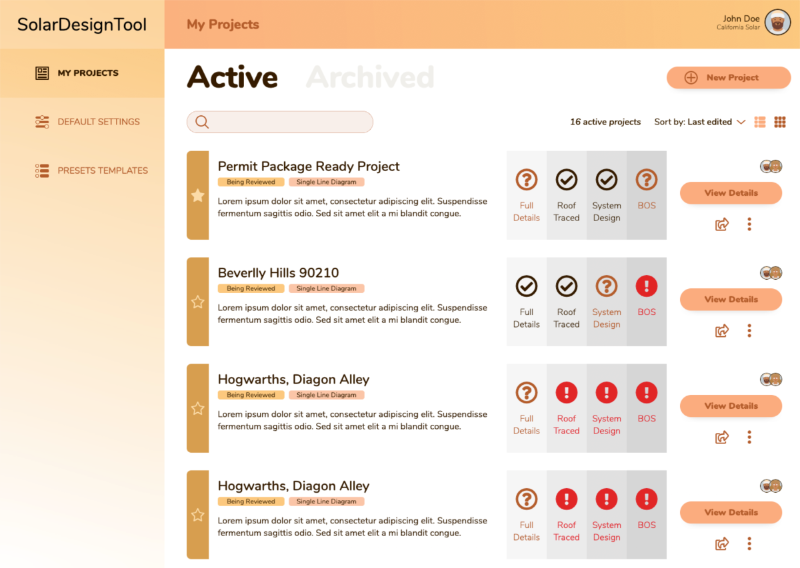
7.1 First Iteration
We redifined the interaction and designed a new interface with a flexible process for the final users. As usual we started on the whoteboard and followed up wireframing and prototyping in high fidelity.

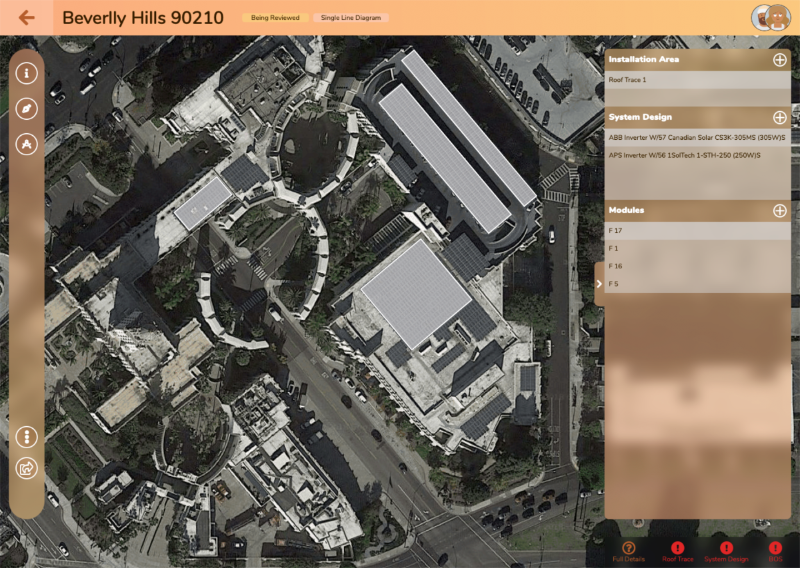
7.2. Second Iteration
After our first testing round we started iterating on the UI design.
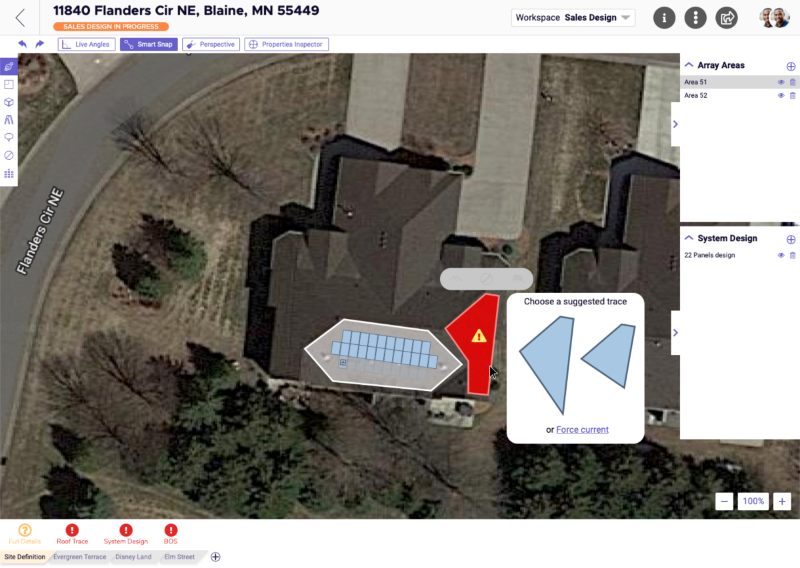
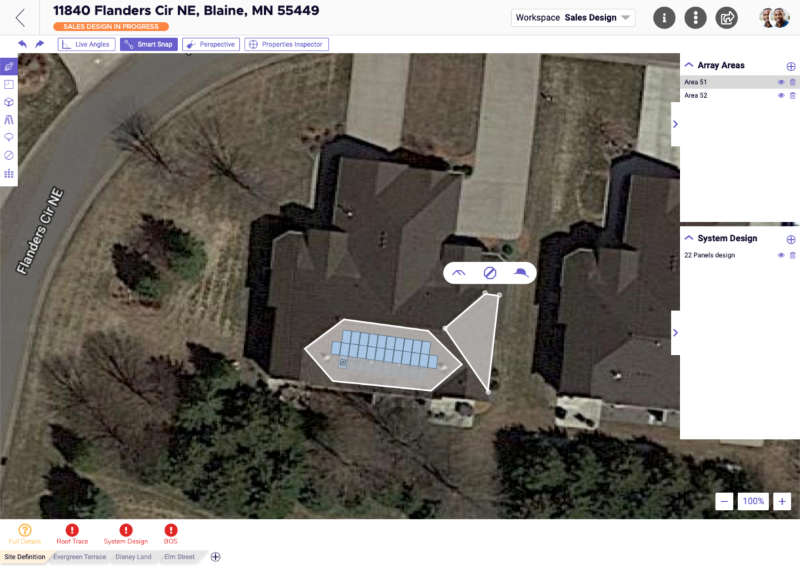
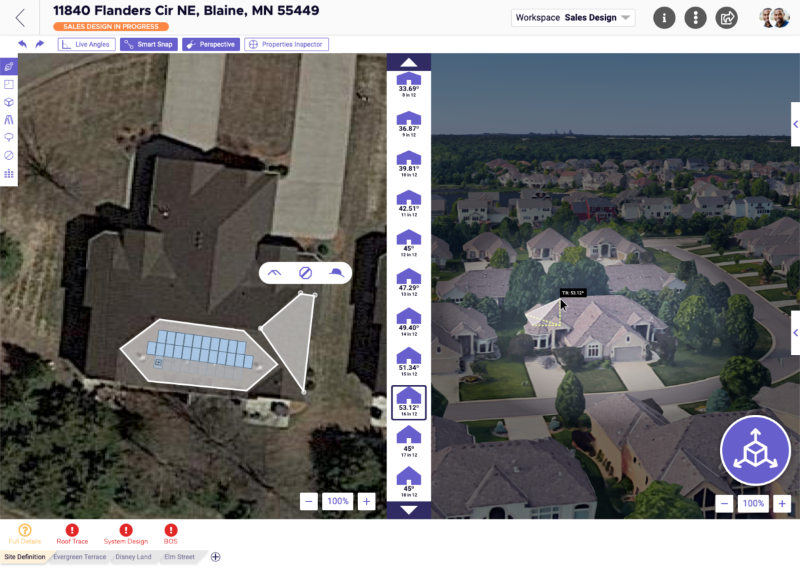
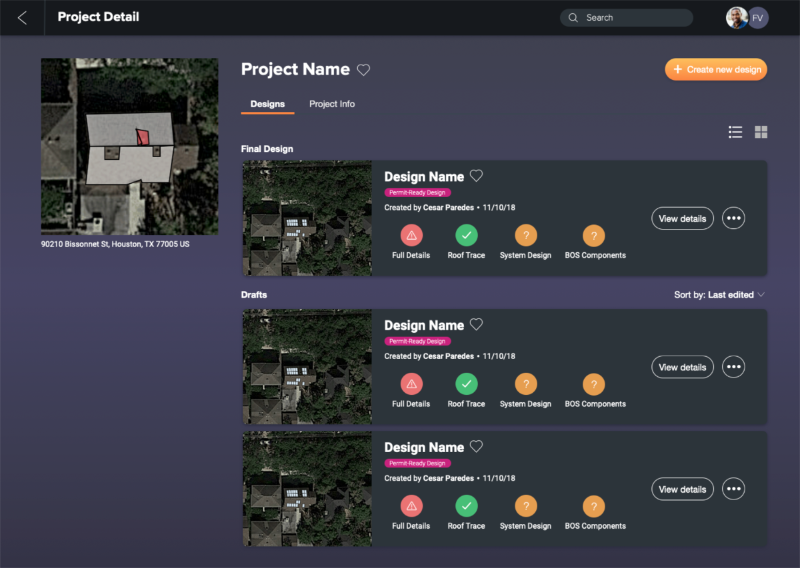
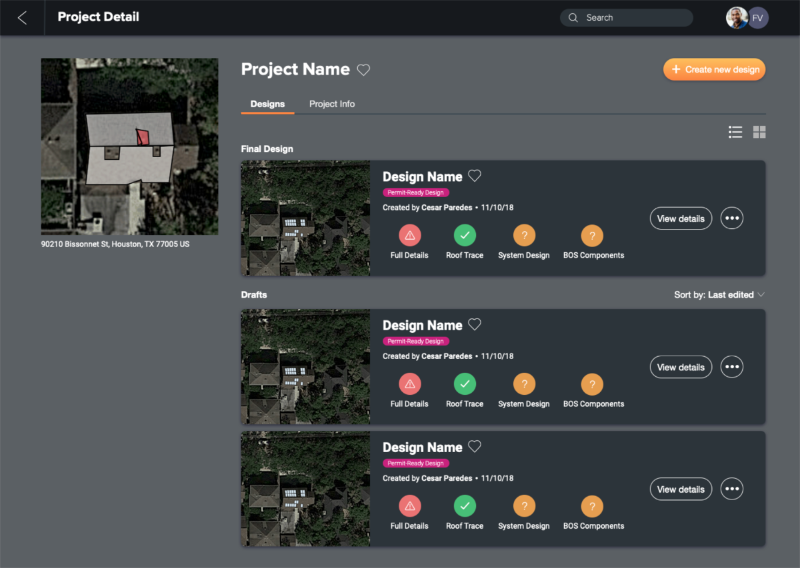
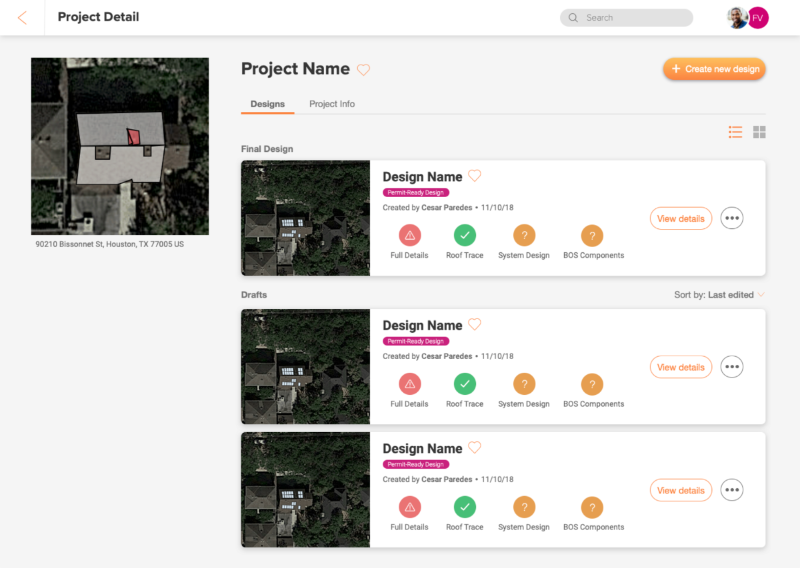
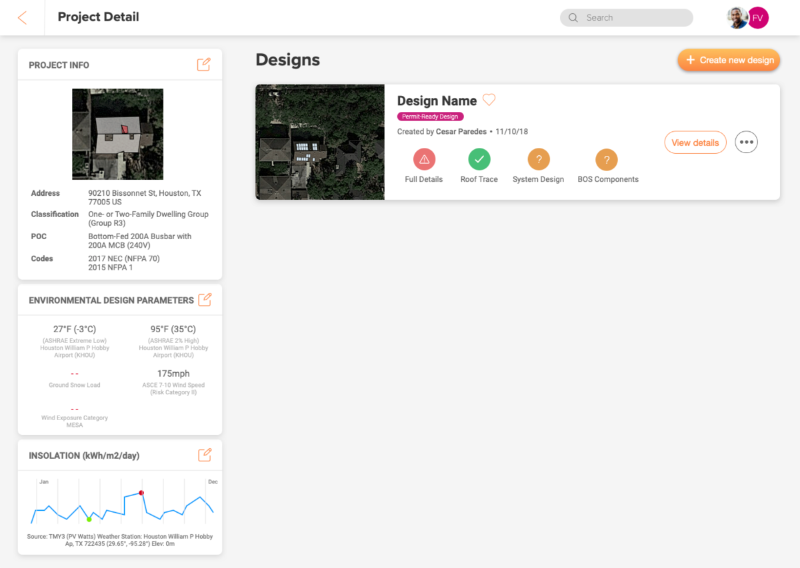
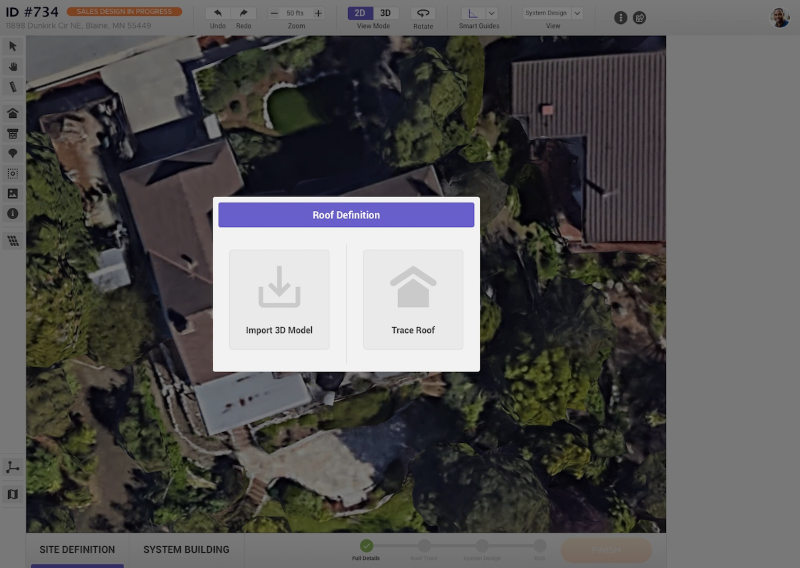
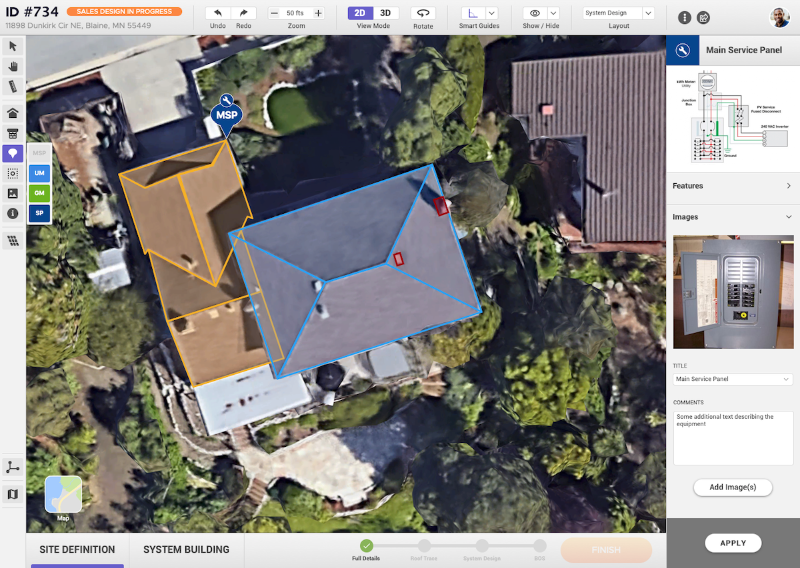
7.3 UI/VD Design
After a good amount of testing and getting on the right track we started to iterate on the visual aesthetics aspect of the interface.
Acknowledgments
Project Lead UX Designer: Fiorella 'Verde' Vercelli.Final (production ready) UI Design: Alejandro Spina.Project Business Analyst: Milagros Terrones.Team Managers: Bárbara Lipinski and Sergio Infante.